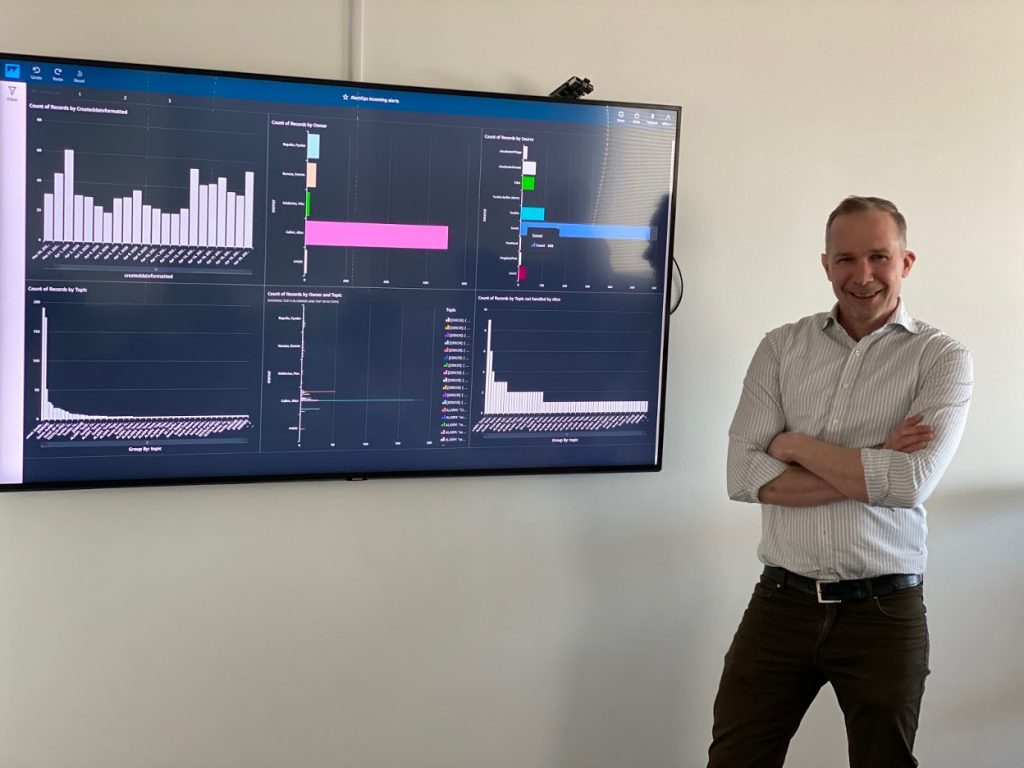
My name is Max Koldenius and I’m responsible for Operations at TIQQE. This blog post will cover some personal thoughts on monitoring and also some specific examples from AWS Quicksight.
Monitoring
Monitoring. Logs. If everyone is doing their job properly, monitoring should be a very boring activity. Nothing exciting should happen, that’s kind of the idea. And, as with all boring things, that usually leads to people doing more fun things instead, and I can’t blame them. But it could be very dangerous if your business is dependent on some component which is very boring to monitor and your DevOps team is developing some new fun stuff instead of checking on it.
Of course, setting up alarms and alerts is your first line of actions to avoid these problems, but there will be stuff that is hard to catch with alarms, thresholds and triggers. For example, if your “incoming-order-integration” looks normal on Black Friday, that is not normal but will be very hard to detect with an alarm or even all the fancy Machine Learning tools available.
So, from my experience, here’s some important things to remember:
- Push monitoring to people rather than having people (hopefully) pull stuff from logs etc. A nice tv-monitor on a strategic place in the office is working fine.
- Visualize things! Computers are good with numbers, people are good at detecting patterns. So let’s leave the numbers for the computer and let’s visualize for the humans.
- Give it a good thought when choosing what to monitor. Don’t start with what the tool is capable of or what data you have access to, but ask yourself what you really need to know to avoid any problems.
- Always improve your monitoring. Ideally you should ask yourself for every new incident if it could have been avoided by alarms or monitoring.
AWS Quicksight
Over the years I’ve been using a lot of different tools for monitoring, and every application usually has their own report-section with nice reports that you can create, sometimes easy sometimes hard…
The problem with this, related to my list above, is that we usually are dependent on data from many different sources to create some meaningful content for our tv-screen. You usually run into problems very quickly when using different tools, authorization-issues, different design templates, keeping up to date with different tools, increasing costs etc.
From my experience it’s highly recommended to gather data in one tool and use that for monitoring. For us, that tool is AWS Quicksight.

There are tons of documentation about Quicksight, start here if you want to know more: https://aws.amazon.com/quicksight/. I will just add some personal reflections on using Quicksight in our daily operation:
- We almost always use plain files as input data for our dashboards. Just dump files in a S3-bucket and you can extract all kinds of interesting data from it. Nice!
- It’s super easy to quickly create basic graphics, perfect for monitoring incoming files, check trends, identify strange patterns etc. It’s a bit limited if you have specific design needs.
- It’s worth putting some extra effort into the basic data, preferably at an early stage. If the basics are there, the rest is very simple.
- Since all our workloads are in AWS, there is no reason for us to use anything else.
Example of my favourite Quicksight visualization
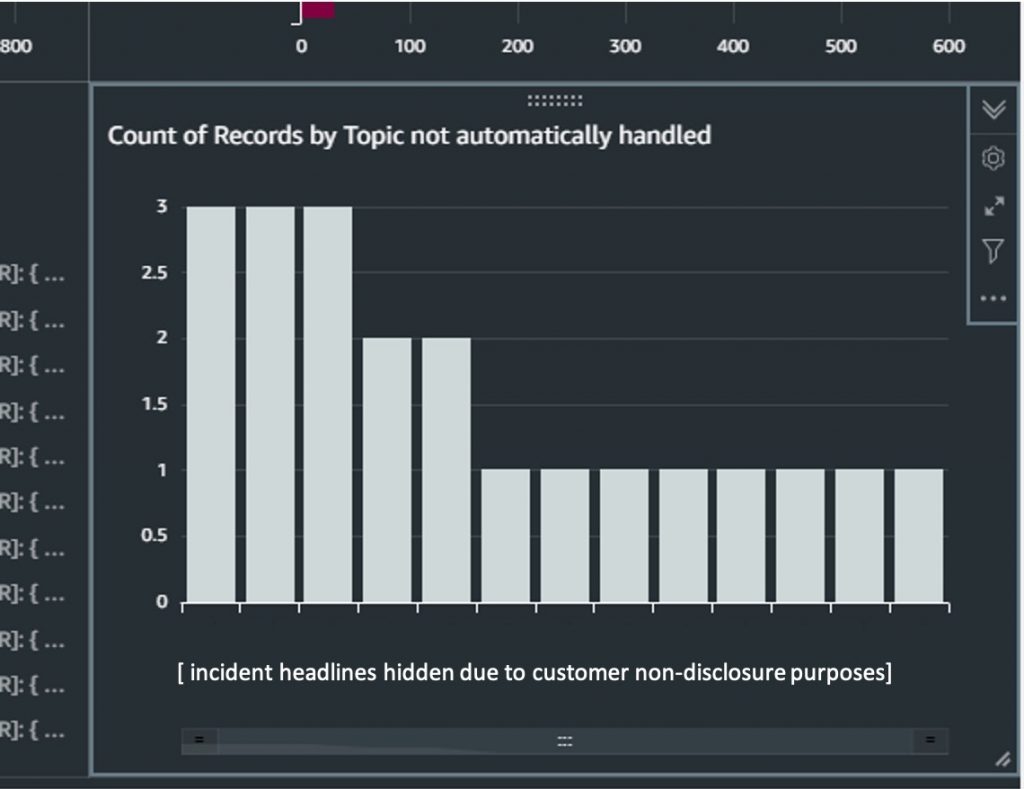
One of my favourite KPI:s is this one where we can see the most frequent incoming alerts that are not handled be our automatic incident handler. For more on this topic, take a look at my AutoOps talk.

So, these are the activities we have completed to create this visualization:
- Create an outgoing API-call from our issue handling system that triggers on resolved issues. The API-call sends a request to a Lambda function that simply saves the json for the issue to an s3-bucket. The most important thing is in place!
- Configure an Athena database to enable SQL querying on the json data.
- Create a data set in Quicksight pointing at the Athena database.
- Create a new visualization in Quicksight, drag and drop the desired data into the visualization, in this case Topic and Owner.
- Done. An all serverless monitoring solution is set up!
Step 1 and 2 are where you need to put some effort, but it’s surprisingly easy. And when the data is in S3, you can easily create new visualizations based on it.
Quicksight is perfect for follow-up and analysis of data over time. It is not suitable for live monitoring, then other tools work better.
Please drop me a mail if you got questions or comments on the content of this blog post, I’d love to hear your feedback!
Best regards
Max Koldenius, TIQQE


